
Childhood and Adolescent Blood Cancers
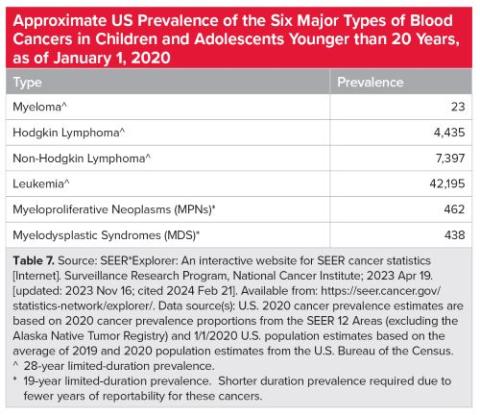
- An estimated 54,868 children and adolescents younger than 20 years in the US are living with or in remission from leukemia, lymphoma, myeloma, myelodysplastic syndromes (MDS) or myeloproliferative neoplasms (MPNs).
- Leukemia is the most common cancer diagnosed in children and adolescents younger than 20 years and accounts for 25.4 percent of all cancer cases in this age-group.
- From 2016 to 2020, the most recent 5 years for which data are available, leukemia and lymphoma accounted for 38.4 percent of all cancer types in children and adolescents younger than 20 years.
- The most common types of cancer in children and adolescents younger than 20 years are leukemia (25.4 percent), cancers of the brain and other nervous tissue (15.9 percent), non-Hodgkin lymphoma (NHL) (6.6 percent), Hodgkin lymphoma (HL) (6.4 percent), and thyroid cancer (6.0 percent).
- The age-adjusted incidence rate of leukemia and lymphoma in children and adolescents younger than 20 years is 7.4 per 100,000 (leukemia, 4.9 and lymphoma, 2.5).
- Leukemia is the second leading cause of cancer deaths (after cancers of the brain and other nervous tissue) among children and adolescents younger than 20 years. This accounts for 24.7 percent of all cancer-related deaths among this age- group.
- From 2016-2020, 4.3 percent of all leukemia and lymphoma cases were diagnosed in children and adolescents younger than 20 years.
- From 2016-2020, 3.1 percent of all blood cancers (leukemia, lymphoma, myeloma, MDS and MPNs*) were diagnosed in children and adolescents younger than 20 years.
* Myeloma, MDS and MPNs are not commonly diagnosed in children and adolescents younger than 20 years.
Source:
- Facts 2023-2024. Facts 2023-2024 provides updates from the American Cancer Society’s Cancer Facts & Figures 2024 (published online in 2024, https://www.cancer.org/research/cancer-facts-statistics. html) for estimated numbers of new blood cancer cases and estimated numbers of deaths due to blood cancers.
The incidence rates, prevalence and mortality data in Facts 2023-2024 reflect the statistics from the National Cancer Institute’s SEER*Explorer: An interactive website for SEER cancer statistics [Internet]. Surveillance Research Program, National Cancer Institute. [Cited 2024 March]. Available from https://seer. cancer.gov/explorer/.